

Zoom is a feature to enlarge elements and tools in Google Sheets and Excel. If you are working on Graph, you may need to zoom in or out of the Graph or the graph dataset. This post will discuss ways of zooming in on Google Sheets and Excel.
To zoom Graph In Google Sheets
Table of Contents
Let us discuss some ways of zooming in or out in the Google Sheets environment.
a) To zoom in on Graph
Steps:
1. Open the dataset that you want to convert to Graph.
2. Highlight the dataset you want to convert to Graph. Click on the Insert tab on the toolbar.

3. Choose the Chart option from the menu. The chart will be inserted into the screen. Now go ahead and zoom the Graph.
You can use any of these methods:
i) Using the Graph edges
Steps:
1. Click on the Graph to activate the edges.
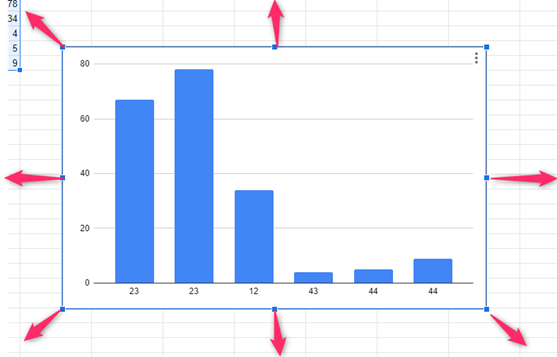
2. Click on the edges icons and move the outwards to zoom in.
ii) Using the View tab
Steps:
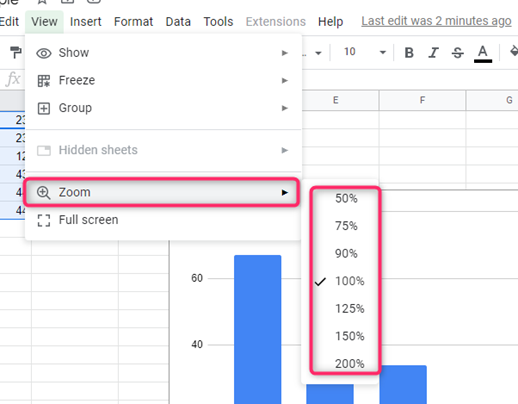
1. On the graph screen, locate the View tab on the toolbar.

2. Hover the cursor over the Zoom option.

3. From the zoom options, choose the zoom-in Option you want.
iii) Using the mouse wheel
Steps:
1. Open the document that contains the Graph you want to zoom in.
2. To zoom in, hold the CTRL button and move the mouse wheel forward.
iv) Using keyboard shortcuts
Steps:
1. Open the document that contains the Graph you want to zoom.

2. Hold the CTRL button and press the Plus button to zoom in.
b) To zoom out in Graph
Steps:
1. Open the dataset that you want to convert to Graph.
2. Highlight the dataset you want to convert to Graph. Click on the Insert tab on the toolbar.

3. Choose the Chart option from the menu. The chart will be inserted into the screen. Now go ahead and zoom out the Graph.
4. Click on the Graph to activate the edges.
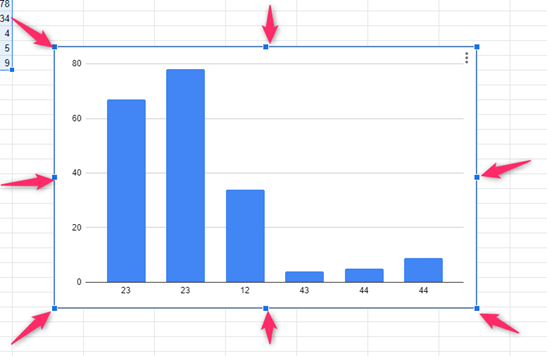
5. Click on the edges icons and move inwards to zoom out.
Alternatively:
1. On the graph screen, locate the View tab on the toolbar.
2. Hover the cursor over the Zoom option.
3. From the zoom options, choose the zoom-out Option you want.
To zoom Graph in Excel
a) To zoom in on Graph
Steps:
1. Open the dataset that you want to convert to Graph.
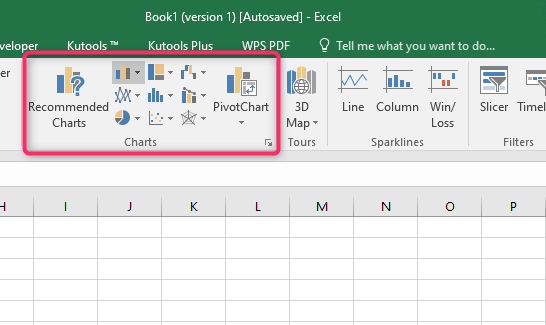
2. Highlight the dataset you want to convert to Graph. Click on the Insert tab on the toolbar.
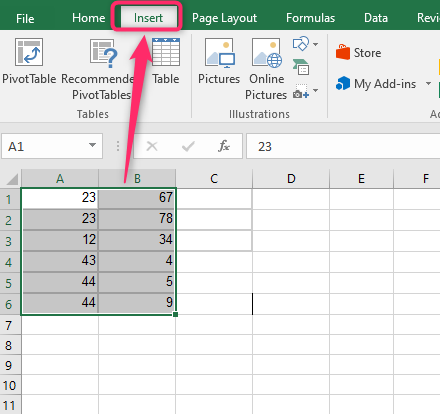
3. In the Chart section, choose the chart you want. Now go ahead and zoom the graph
i) Using the Graph edges
Steps:
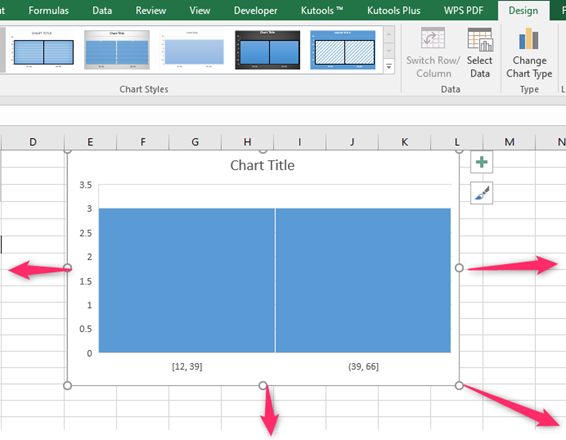
1. Click on the Graph to activate the edges.
2. Click on the edges icons and move the outwards to zoom in.
ii) Using the View tab
Steps:
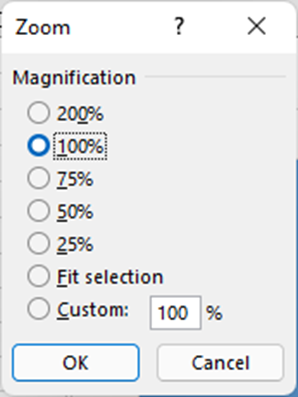
1. On the graph screen, locate the View tab on the toolbar.
2. In the zoom section, click on the Zoom button.

3. From the zoom box, choose the Zoom option you want.
iii) Using the mouse wheel
Steps:
1. Open the document that contains the Graph you want to zoom in.
2. To zoom in, hold the CTRL button and move the mouse wheel forward.