P-value is considered to be one of the most important concepts in statistics. Most scientists rely on the p-value when working on research projects. This value is used to check whether some hypothesis is correct or not. Scientists typically choose a range of values that express the normal results when data is not co-related. The p-value enables scientists to know how close they are to the results.
Calculating p-value manually
Table of Contents
Follow these steps:
1. Find the expected results for the experiment you are doing
2. Calculate, then find out the results you have observed from the experiment. Determine how much deviation from the expected results counts as significant, the degree of freedom
3. Using a chi-square, compare the first expected and observed results.
4. Find the significance level
5. Using the chi-square, approximate your p-value
Using Google Sheets enables you to avoid the risk of getting wrong results or using false calculations. You can double-check if you have the correct values or see whether you have used the right formulas. Using this method requires calculating and considering doing it with a pen or paper.
Using Google Sheets
First, make two sets of data, compare the data sets, and check whether there is a statistical significance between the two. Using an example, let’s compare data for a certain coach. This is about the client’s number of pushes and pull-ups that the coach provided. The T- TEST function will compare the two sets of data. The syntax of the function is;
TTEST (arrau1, array2, tails, type) but you use; T.TEST (array1, array 2, tails, type) too. Both of these syntaxes refer to one function.
Array 1 represents the first set of data, i.e., the pushes for the client
Array 2 represents the second set of data, i.e., the pull-ups for the client.
Tails are the number of tails that are used for distribution. There are two options for this; 1-one – tailed distribution 2-two- and tailed distribution.
A type is an integer number that can be paired with a 1, 2, or 3 variance T-Test. Follow the simple steps now that you know the meaning of the elements in the formula.
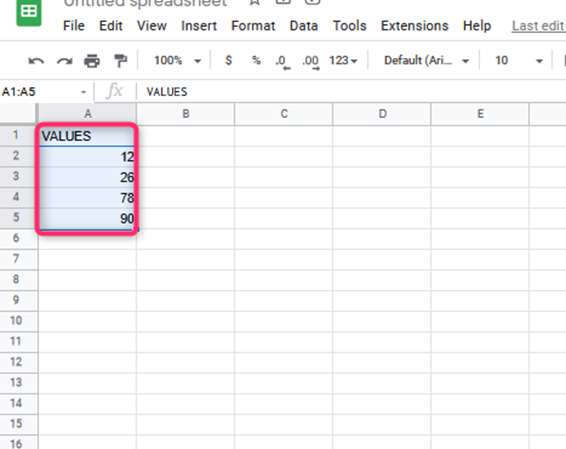
1. Select a column that you want to calculate the p-Value

2. Name the column you have chosen TTEST and display functions
3. Select the empty column that you want p- values to be shown, then type in the formula you need
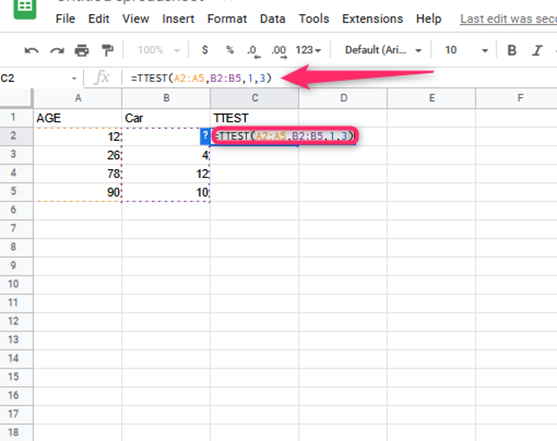
4. In this case, enter =TTSET (A2:A7, B2:B7, 1, 3). A2:A7 is the starting and end of your first column. Hold the cursor in the first position, A2, then drag this to the bottom of the column

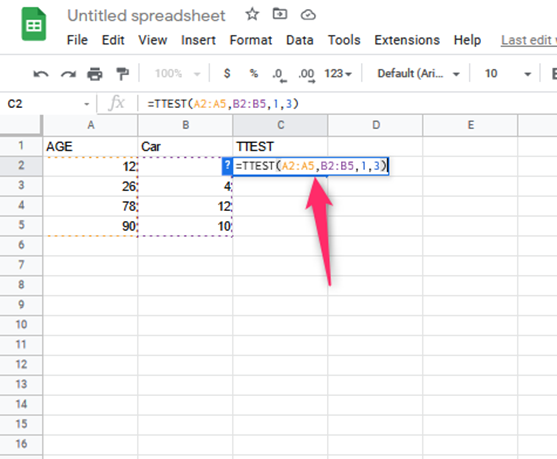
5. Google Sheets automatically updates your formula
6. Put a comma to your formula, then follow the same steps for the second column.

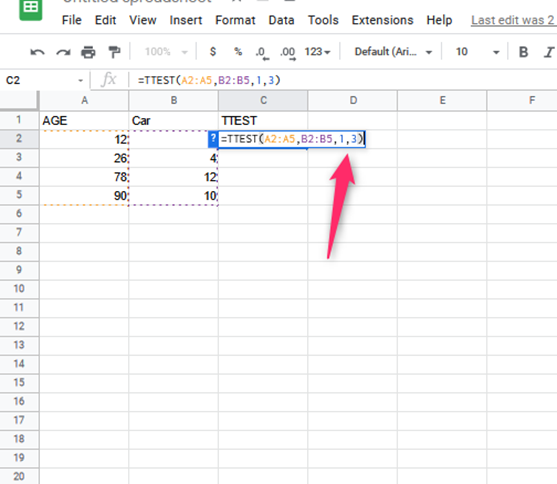
7. Enter the tails and type elements, separating them with commas

8. Press Enter

The results will appear in the column where you have typed the formula.

