

A concept map is a type of map used to explain and illustrate the relationship between ideas. While working on a Google Sheet, you may need to add a concept map that will guide your readers. There’s no direct way of inserting a concept map in Google Slides. However, numerous workarounds can be used to add a concept map in Google Slides. In this article, we shall discuss some workarounds that can be used.
Steps
Table of Contents
1. Open your Google Account. Then, from the Google Apps, Locate the Google Slides and open it.

2. Next, open a new Google slide, or an existing Google Slides that you need to create a map.
3. Add the background color or image of the map. Click on the Background and add the image or default color you want to use as the Background on the toolbar.

Next, you can add the shapes
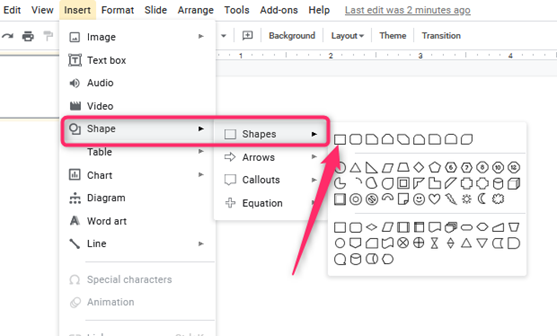
To add circles, click on the Insert tab, then hover the mouse on top of the shapes button and select the circle icon.

4. To add a rectangle, click on the Insert tab, then hover the mouse on top of the shapes button and select the rectangle icon.
Customizing the Google Slides maps
After creating the concept map in Google Slides, you can customize it and add eye-catching features. Here are some of the ways you can customize the Google Slide concept map.
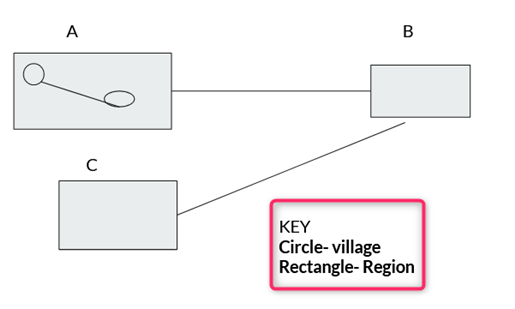
1. Add a key. A key helps the map user clearly understand the map and what it entails.
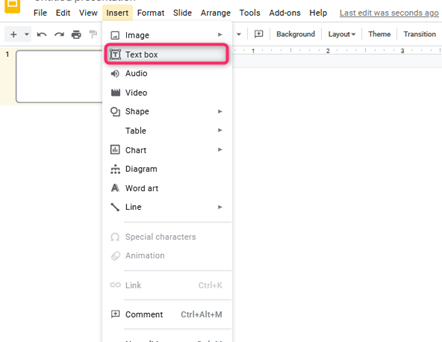
2. Next, you can add a title. That is, click the Insert tab, and then click the textbox button. Add the text box where you want to add the title.
3. Finally, Click the untitled presentation, and rename it with the name of your concept map.
Using Lucidchart to create a concept map
Steps:
1. Open a new Google slide, or an existing Google Slides that you need to create a map.
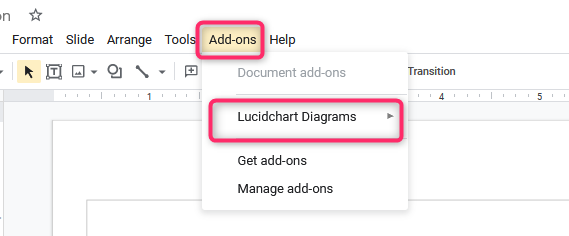
2. Click on the Add-ons button, click on “Works with Slides,” then select
“Lucid charts.”

3. Install, and then click on your email address
4. Allow permissions so that Lucid chart to access your Google account
5. Open the toolbar> Click on Add- ons. Then hover the mouse on top of the Lucid chart button.
6. Then, click the insert diagram button.

7. On the diagram pane, select the diagram that fits your concept map and edit.
Adding a map to your Google Slides document
Steps:
1. On your browser, download editable maps. That is, visit this link to download editable maps https://www.brightcarbon.com/wp/wp-content/uploads/2020/05/BrightCarbons-editable-map-toolkit-for-Google-Slides.odp
2. Next, upload the downloaded file to your Google drive.
Open your Google Account.
Then, from the Google Apps, Locate the Google Drive and open it.

Click the New button, and then click the File upload button.

Finally, select the .odp map file and upload it.

3. Open the uploaded file in Google Slides. Open the document in Google Drive and select Google slides from the open with section.
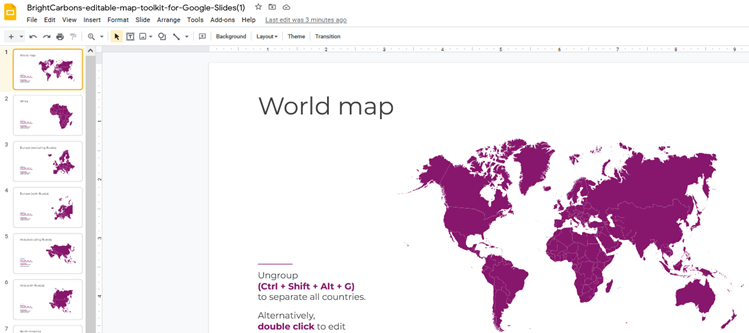
4. There are numerous editable maps. Click on any and copy them.
5. Next, open a new Google slide, or an existing Google Slides that you need to add a map.
6. Paste the editable map there, and edit it to meet your desires.