

A pivot table is used to find patterns and recognize the information. It can be done on the google sheet or created manually.
Steps
1. Open your spreadsheet, which contains the source of the data.
2. At the bottom of the spreadsheet, right, click explore.

3. Scroll down to the pivot table. To the pivot table section, check on the suggested pivot tables; click more for more additional suggestions.
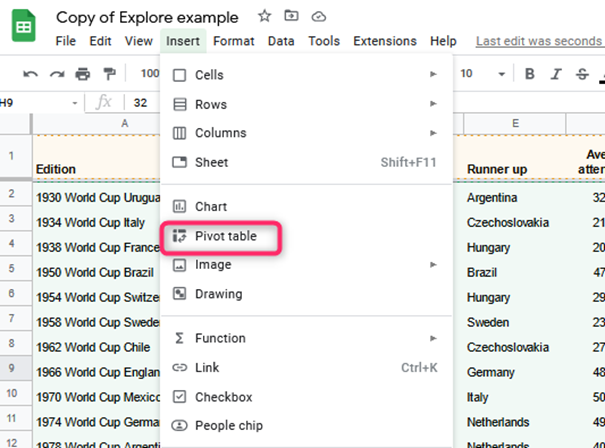
4. After selecting the pivot table you need, click the insert pivot table, and the new table will be added to the sheet.

How to create a pivot table manually
Table of Contents
1. Open the spreadsheet and select the column with the data you need to analyze. The data should be in a column with the headers.
2. Click insert the pivot table.

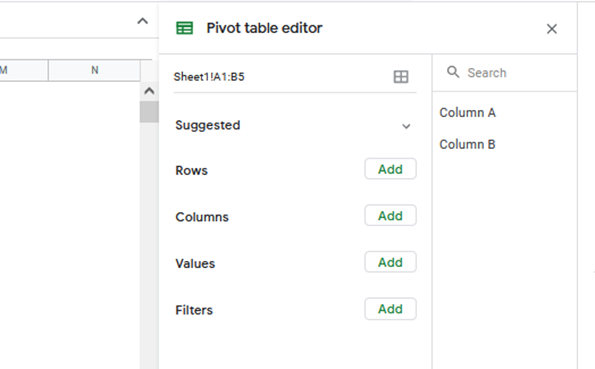
3. Below the insert, choose a place to add your pivot table.
4. Click to create the table.

5. Right-click to use the pivot table suggested and select the table, though this is optional.
6. If you need to add data manually by column or row or if you need to filter data, click add and choose the data to use.
7. If you need to add the data manually by the value, click add and choose an option; select a column to use, use a custom formula, click on the calculated field, and enter the formula.
8. Under summarized by, select custom.
How to work with a pivot table
- Create a custom formula
As shown above, create a custom formula that you need manually.
- Create a custom groups
Select the items you need to use, or you need to see in their groups.
- Showing the details behind the data
Double click a value you see its source data.
Editing the pivot table
Click at any place anywhere in the pivot table to open the editor.
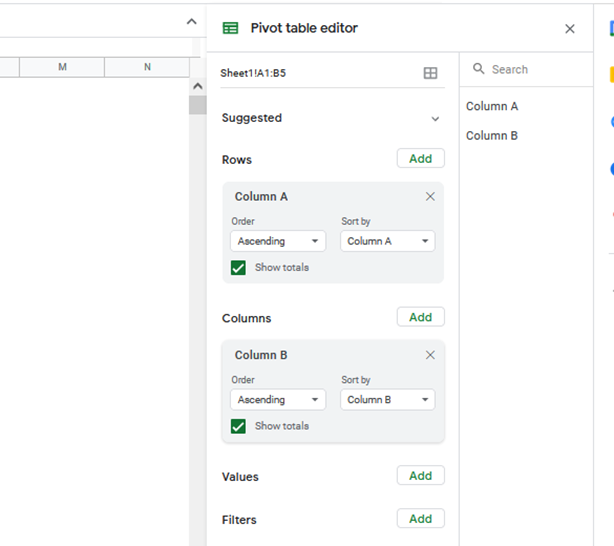
1. Add data; depending on where you need to add the data, under columns, rows, or even values, click add.

2. Change rows or column names, double click the row or the column name, and enter the new name.
3. Change order or column; click the down arrow under the order under rows or columns. You can also click the sort by and make a selection of items or the option.

4. Change data range, click the range of data and enter the new range.
5. Deleting data, Click remove.

Hide the data with filters
1. Click ads and select the column you need to filter under the filters.

2. Under show, click the down arrow and add the items you need to hide.
3. Click OK.
How to ungroup pivot data?
1. Open the existing pivot table or create a new one.
2. Select the row or the column and the items you need to group together.
3. Right-click a selected item and click on the create pivot group.
4. To ungroup, right-click a grouped item and ungroup pivot items.