

Q1 is the middle of any data set, also called the Interquartile range. The q1 is one of the quartile functions that makes it easy to calculate quartile ranges without arranging data from the smallest to the largest. This function uses the min and max numbers in the dataset to find the value you want. Another importance of using the q1 calculation is that it helps determine the deviations in your data set.
Manual determination of q1
Table of Contents
First, determine your data’s minimum, maximum, and median points. Determine the middle points from each side of the values. Start from the minimum value to the median and from the median to the maximum value. In this case, the q1 is the value in the middle of the minimum value and the median value. Another common computation, in this case, is finding the interquartile range. Use the following steps in this case
1. Divide the data set into equal parts
2. The thee cut marks, label as Q1( first quarter), Q2( second quarter), and Q3 (third quarter)
3. To get the q1 (interquartile range), find the difference between the first and third quarters.
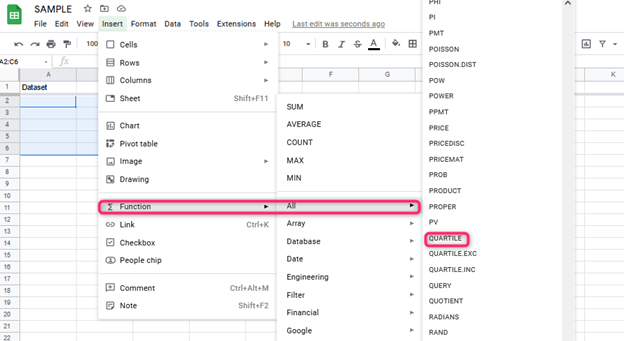
In Google Sheets, various methods can be used to find q1. These are;
Find q1 using the quartile function
The method comes in handy to determine the distribution of data points in a data set. The general formula of the Quartile function is Quartile (data, Quartile_ number. The quartile_number tells us the quartile number you are looking for.
For example,
- 0 is the minimum value in the dataset
- 1 is the first quartile number or the 25th percentile
- 2 is the second Quartile or the 50th percentile
- 3 is the third Quartile or the 75th percentile
- 4 is the maximum value in the data set.
Using the following simple steps;
1. Open the Google Sheets document and put the datasets in the cells

2. Select the cell you want to find, the q1 thus making it the active cell.

3. Type in the formula =QUARTILE(data range, 1); we use one since we are looking for q1, the first quartile

4. Press Enter
5. You have now found the first Quartile of your dataset. Modify the argument in the formula to find the second and third Quartile.
According to the formula,
= this sign is how you start any function on Google Sheets
Data is the range that has the data set you are using
The quartile number is the value we are looking for is the value we are nearest to the first Quartile, i.e., q1
Find q1 using the percentile function
The only difference between the percentile and quartile functions is that you replace the quartile function with the percentile function. Use the simple steps below;
1. Select the cell you want the result to be displayed

2. Type in the formula =PERCENTILE (data range, 1)
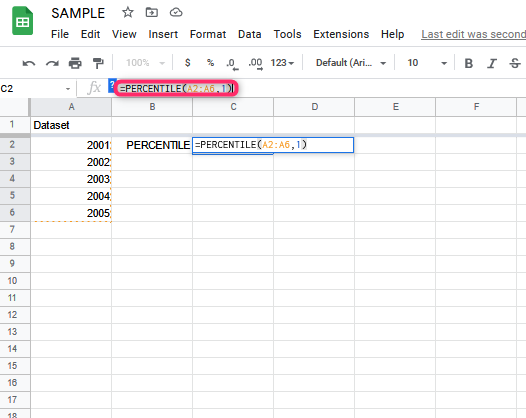
3. Press Enter
