

Graphs help to visualize a given set of data. Numerous tools are used to create graphs. Ms. Word is well equipped with tools that can be used to create graphs. If you are new to graphs in Words, this is for you. Below are common ways of adding graphs in your Word document described in depth.
Using Word Tools to add graph
Table of Contents
Here are the steps to follow:
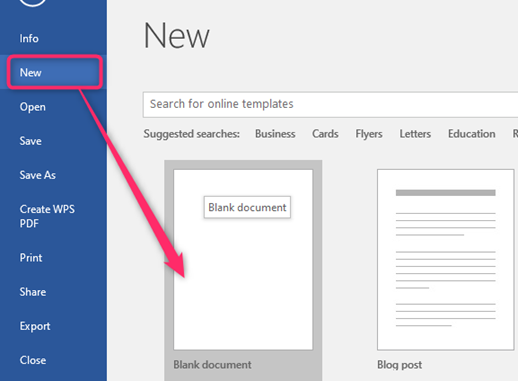
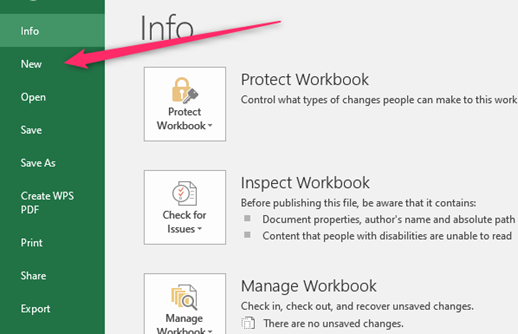
1. To get started, locate the Word application on your Pc. Double-click on it to open the application. To create a new document, click the File button on the toolbar. Then, locate the New button.
You can also use the keyboard shortcuts to open a new document. That is, CTRL + N. Alternatively, open an existing document that you need to add to the graph.
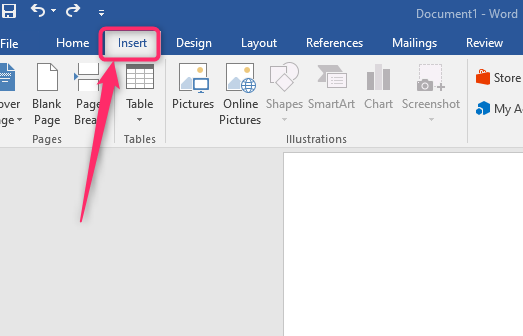
2. Position the cursor where you want to add the graph.
3. On the toolbar, click the Insert tab.
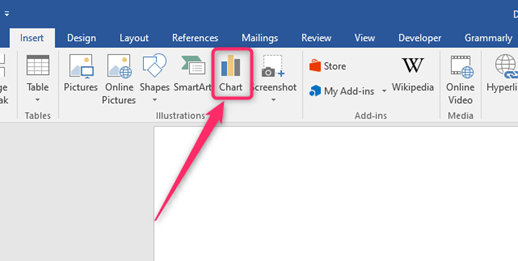
4. From the insert pane, locate and click on the Chart button (located in the illustrations section).
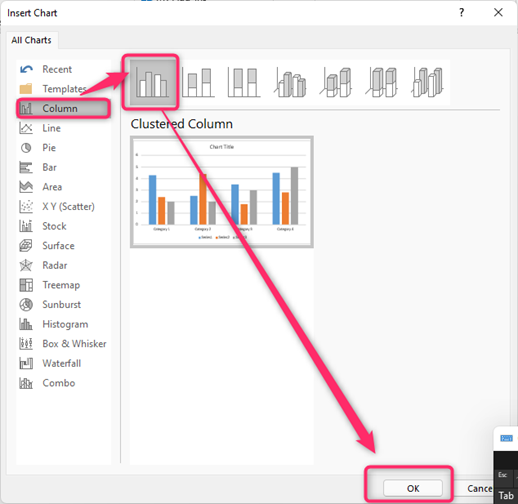
5. In the Insert chart dialogue box, there are several types of graphs.
6. Select the one you want by clicking on it. Then, select the Format of the graph from the right pane of the Insert chart dialogue box.
7. Finally, hit the Ok button, and a sample graph will appear in your document.
How to customize graph in Word
Here are the steps to do so:
1. Click on the inserted chart to open the Excel window that contains the value of the graph.
2. Edit the default values and title on the Excel window, then add your graph’s data.
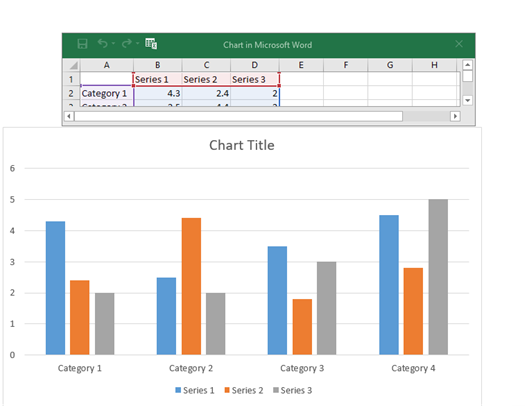
3. Click anywhere outside the excel window, and the Word graph will automatically update.
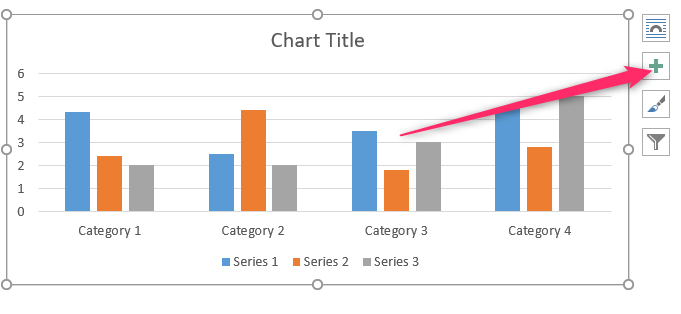
4. To change the graph’s layout, click on the added graph and locate the layout options button on the top-right side of the graph.

5. To alter the Chart elements, click the Plus sign button on the graph’s top-right side.
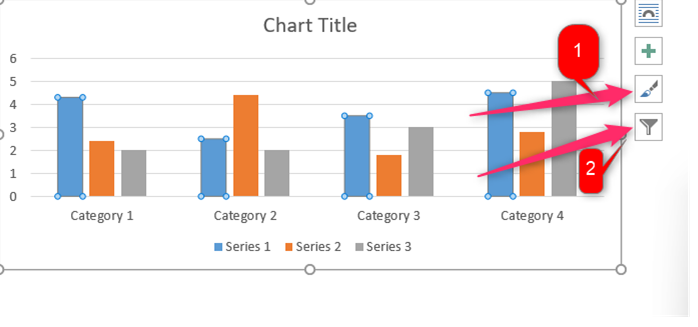
6. To change the style of your graph, click on the Chart style button located on the top-right side of the graph.
7. Finally, click on the Chart Filters button to alter the chart’s filters.
Using Excel tools to add a graph to Word
Since Excel and Word are compatible, you can create a graph in Excel and transfer it to your Word document. Here are the steps to do so.
1. Open your Excel app on your pc. Open a new file (Click the File tab, and then locate the blank button).
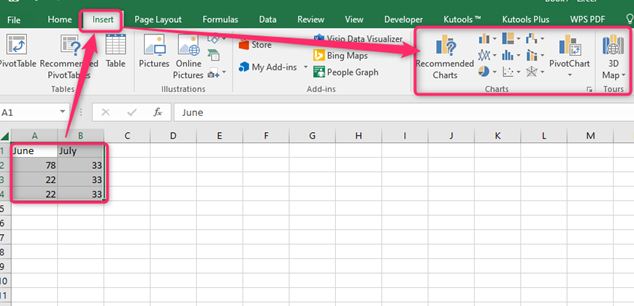
2. On the empty cells, add your graph’s data and highlight them.
3. Click on the Insert tab on the toolbar.
4. Locate the chart section, and select the graph type you want by clicking on it.
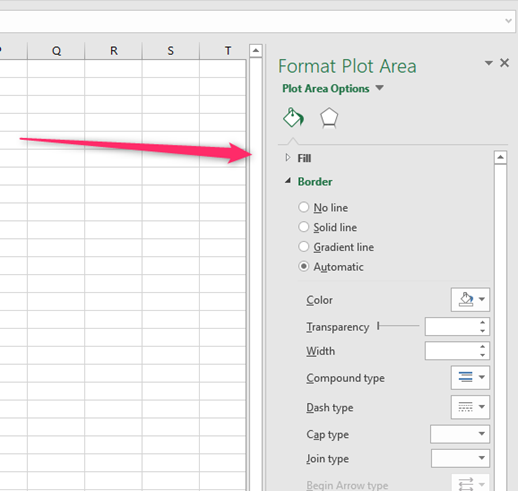
5. To customize the graph in Excel, double-click on the inserted chart to open the Format Plot area pane on the right side of the screen.
6. Click on the graph and copy it. That is press CTRL + C.
7. Open your Word document, and place the cursor where you want to draw the graph.
8. Right-click and select the Keep formatting paste option.
