

A T-test is a type of inferential statistic used to determine if there are significant differences between the means of two groups that may be related to some features.
Procedure
Table of Contents
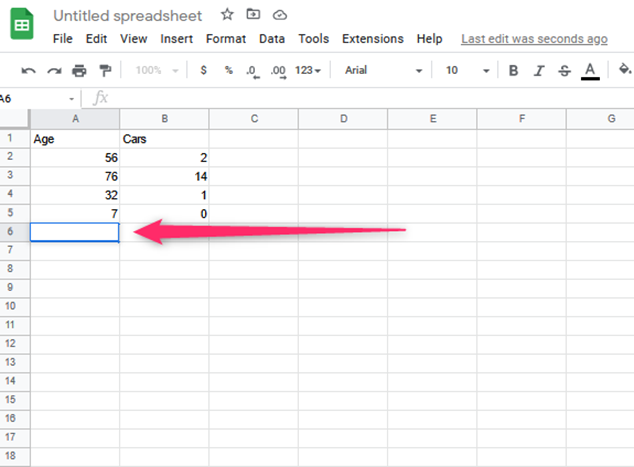
Open the datasheet
1. Open your data in two columns of independent groups or the independent samples. If there exists, if not the, create and use.
2. Calculate the average beneath the first column. These are the first values within the 1st column, independent of the other column.
3. Type an equal sign and then average in the space below it. It is done in the same order.
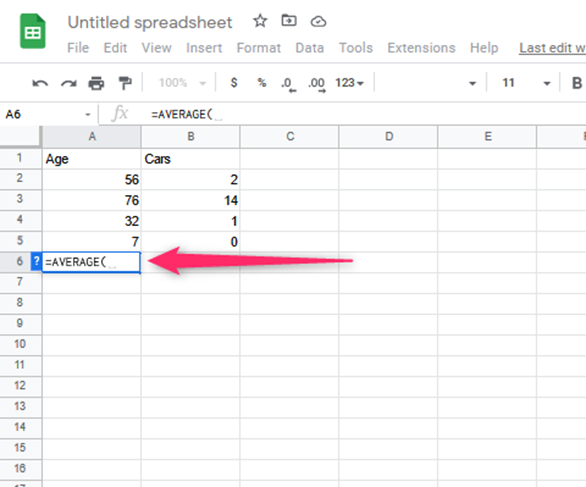
4. Open the parenthesis and put in your values indicated above.
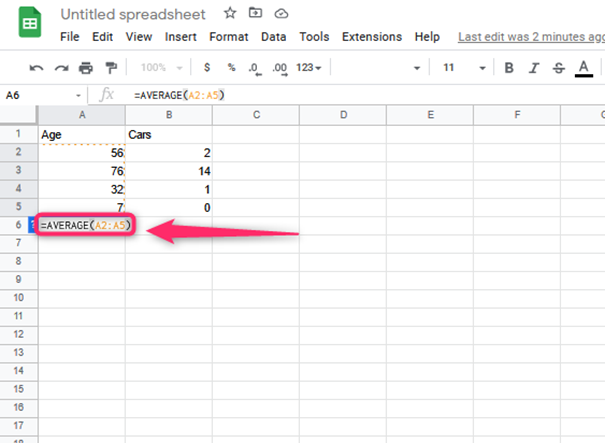
5. Copy and paste the whole column and type enter.
6. The average will be indicated in the space.

7. Click at the lower corner of the Average position and drag to the other row of the next column.
8. The average will have a slight difference in them.
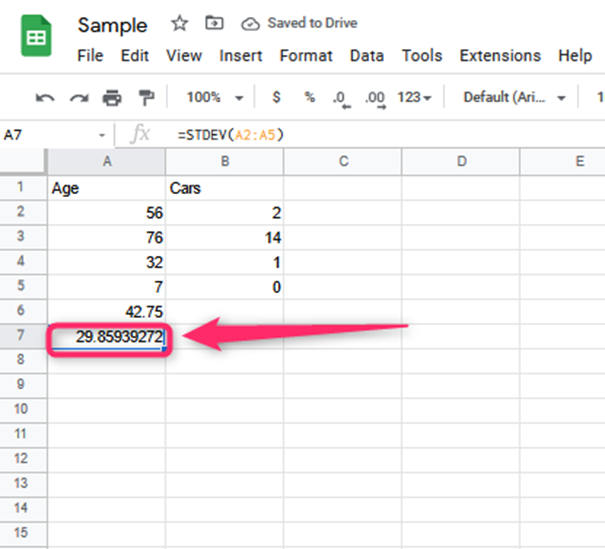
Using standard deviation
Steps
1. Type standard deviation, “STANDARD DEVIATION” at the column below the calculated mean.
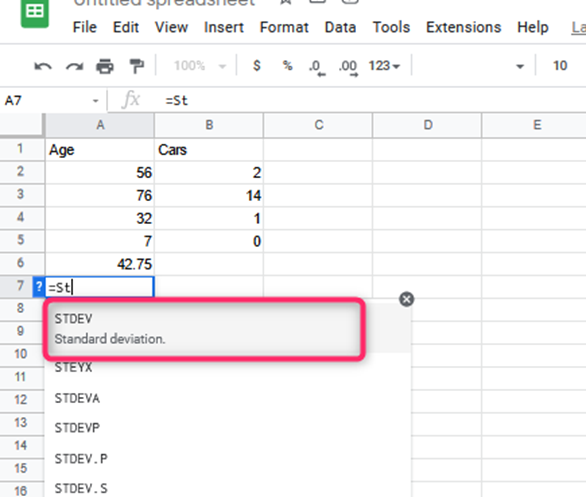
2. Open the parenthesis
3. Copy the first column
4. Paste the copied column
5. Close the parenthesis

6. The average will be displayed.
7. Click the lower corner of the average position and drag to the other row of the next column.
8. The average will be displayed in the other column.
9. The average will be different.
T-test
1. Pick another column.
2. Type t-test.
3. In the next column, type an equal sign followed by T TEST.

4. Open up the parenthesis.
5. Feed the first sample by copy-pasting it in the open bracket.
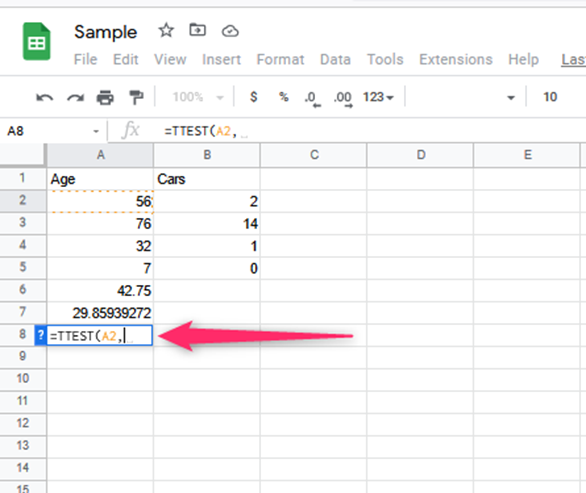
6. Type a comma. Copy pastes the next column after the comma
7. Put a comer; this space specifies the number of tails.

8. Put either one or two. If you pick one, you need to put a one-tail distribution. If you pick a two, you need to use a two-tail task.
Kinds of t-test
- Paired t-test.
- Unpaired t-test.
- One sample t-test.
Unpaired t-test
1. Type 2 and close the parenthesis.
2. Click enter. The result will be indicated.
3. The displayed value is the p-value, the probability.
If the p-value is less or more, use 0.05. thus it is the t-test report.
The average of the 1st is different from the 2nd average.
Paired t-test
1. Type the equal sign, and after the parenthesis, type e 1
It means the same testing thing but in two different periods.
Here the improvement is checked from day to day as an example. It is also the same as the dependent sample.
One-sample -test
It compares a known average to your sample’s average.