

Google sheet is a powerful tool for creating visual data using charts. Therefore, it can be used for data representation and comparison purposes. Google sheet has the option to include a legend with labels on your chart. It makes the chart more appealing and eases the process of examining the chart. However, the default legend labeling in Google Sheets may not fit your desires, and thus Google sheet allows users to edit and format legends. This article shall discuss some of the techniques used to label the Legend in Google Sheet.
Adding a label to a Legend In your Google sheet
Table of Contents
Label legend comes after creating the chart. However, if the label legend is not displayed, you can add it using these steps:
1. You must have a chart where you need to add the label legend. To create a chart in Google sheet, follow these steps:
-
Enter the dataset of your chart in the given columns. For example, column A and column B.

-
Then, click the insert button from the menu, and select the chart option.
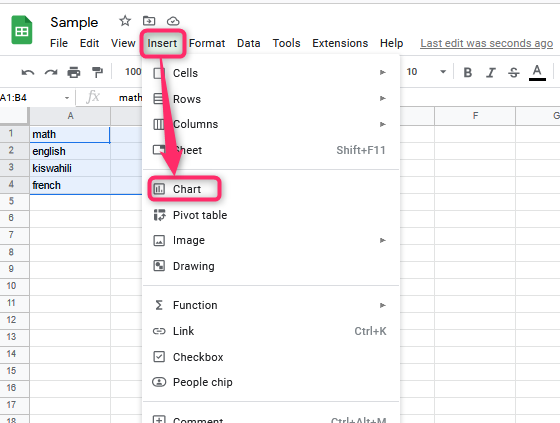
-
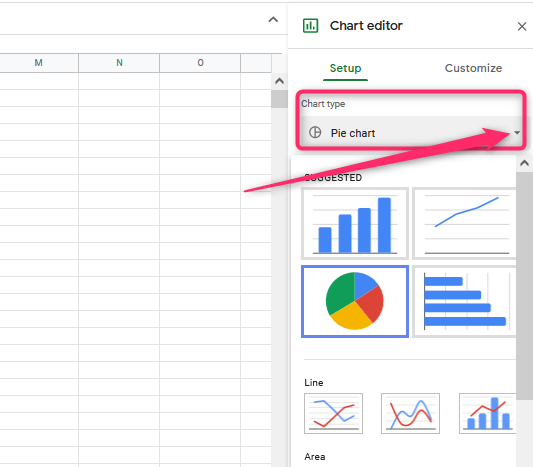
Finally, you can change the type of the chart. Click the chart type drop-down menu, and select the chart of your choice.
2. Then, Locate the label section and click the space. It will prompt you to select the column you want to use as the label of the Legend. Alternatively, you can highlight the column from your table.

3. You can also use the Use column A as a label option to add labels to your chart.

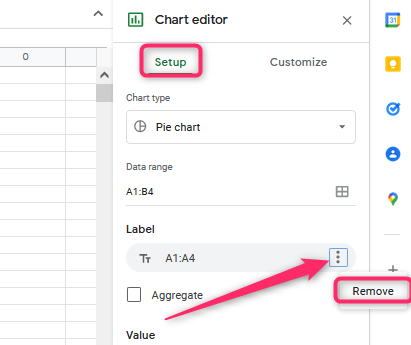
To remove the label legend, follow these steps:
1. On the chart editor dialogue box, choose the Setup tab.
2. Then, locate the label section. On the right side of the selected label, there are three dots. Click on them and select the Remove button.
Changing the position of Legend
Google sheet has a default positioning of Legend. However, you can change the position of the Legend. Here are the steps to do so:
1. On the chart editor dialogue box, choose the customize tab.
2. From the list displayed, select the Legend option.

3. Then, click the drop-down button next to Auto on the position section.

4. Select the new position of the Legend.
NOTE: The None position is used to hide the Legend. That is, the Legend will not be displayed.
Formatting the Legend
After positioning the Legend, you can go ahead and change its format.
Steps:
1. On the chart editor dialogue box, choose the customize tab.
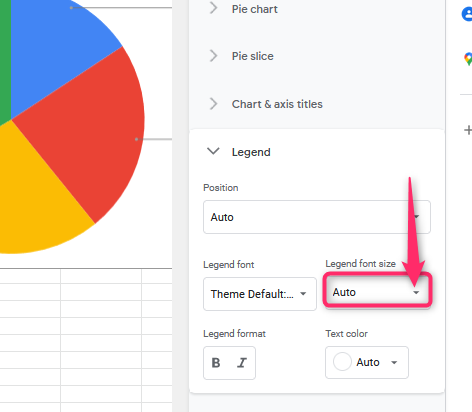
2. From the list displayed, select the Legend option.

3. To change the font of the Legend, click on the drop-down button next to Theme default. Select the font you want.

4. To change the Legend font size, locate the Legend font size section and click the drop-down button next to Auto.
5. To change the format of the Legend, locate the Legend format section and click either B (bold) or I (italic).

6. Finally, to change the color of the Legend, locate the Text color section, and click on the drop-down button next to Auto. Select the color of your choice.
