

Bar charts are known for their mighty power of visualizing data. When creating a bar graph using Google Slides, you need to be linked to Google Sheets. Google sheets have cells that allow the input of data. It is easier to insert a chart from the Google sheet data. However, you can create a bar chart from scratch using Google Slides. In this article, we shall discuss some of the steps to create a bar chart using Google Slides.
Steps:
Table of Contents
1. On your favorite browser, log in to your email using your email address and password.
2. Then, click the square dotted icon on the right side of the screen.

3. Choose the Slides option from the various displayed options.

4. The slide’s screen opens. Choose the blank document.
5. After opening the Empty slide, select the slide where you want to insert a chart.
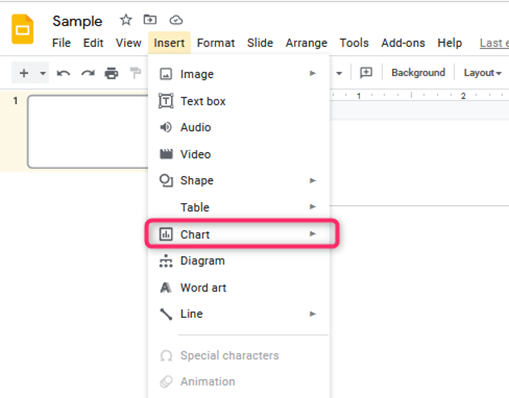
6. On the top bars, click the Insert tab. Hover your cursor at the top of the chart button.

7. From the drop-down menu, select the bar button. A bar graph is displayed on the screen.

8. Alternatively, you can create a chart from Google Sheets and import it to your Google Slides. To do so, follow these steps;
- Click the Insert tab, and then hover the cursor on top of the Chart button.
- From the drop-down menu, select the From Sheets Button.
9. Go ahead and edit the chart.
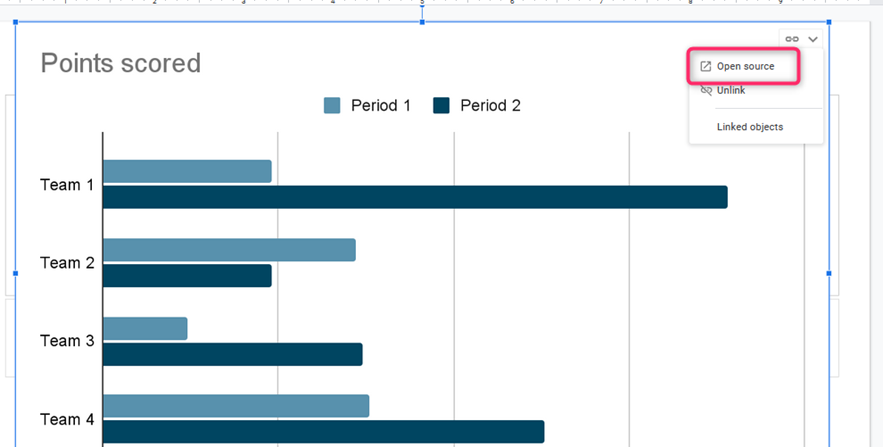
- To edit the chart, click Open source. It will open the chart’s data in the Google sheets.
- Add your new details on the Sheets cells.
- Go back to Google Slides and click the Update button.
That is all. Your charts will be added to the selected slide.
Copy and paste the Bar Graph method
It is the simplest method of adding a bar graph to a Google Slide document. These steps are involved:
1. Open the Google Sheets document that contains your bar chart.
2. Click on the chart and press Ctrl + C to copy the chart. Since Google Sheets and Slides are compatible, you can easily copy and paste.
3. Next, open the “Google Slides.” Locate the “slide” you want to add the bar graph.
4. Then, press Ctrl + V to paste the chart. Alternatively, right-click on the selected slide and then select the Paste button.
The chart will appear.
Editing the Bar Graph in Google Slides
While modifying Bar Graph in Google Slide, you need to open it in your Google sheet. Follow these steps:
1. Select the Bar chart to edit in your Google Slides. From the Link options drop-down menu, choose Open Source. Doing so, the Google Sheets will open.

2. This is where you’ll edit your chart.
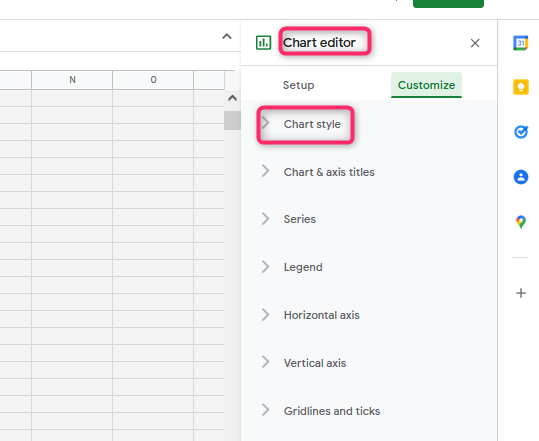
3. Click on the table to open Chart Editor. From the chart editor, locate the Customize, and click on it. It is where you will adjust various settings.

4. To change the chart style, click on the Chart style button.
5. To set the position of the bar graph, click the Legend sub-menu.
6. Next, you can alter the axis by choosing either the Vertical or Horizontal Axis.
