As its name suggests, a pivot table is a table that can be moved around. That is, it is pivoted. It is easier to group, divide, and isolate your data in diverse ways with pivot tables. Due to its pivot nature, the user can analyze the dataset and derive the relationship in the dataset given. Moreover, a pivot table is used to condense the table into a better view for analysis. Let’s discuss the steps to be followed in creating a pivot table.
Steps to create a pivot table
Follow these steps when creating a pivot table:
1. Open the Google sheet using the browser of your choice. That is, go to https://docs.google.com/ and log in using your email details.
2. Then, on the empty cells, enter your dataset and highlight all the cells that contain your dataset.
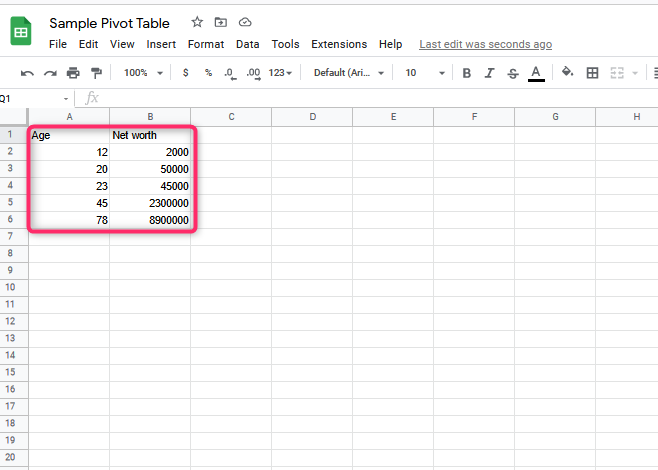
3. Alternatively, you can only enter the dataset and proceed without highlighting. Before inserting the pivot table, you’ll be prompted to select the cells that contain your dataset.
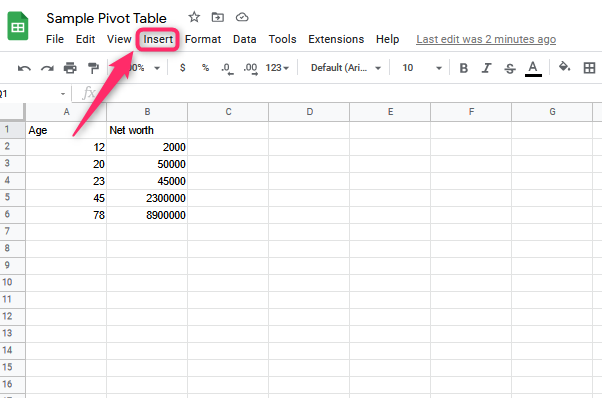
4. Locate the Insert tab button on the menu bar, and click on it.
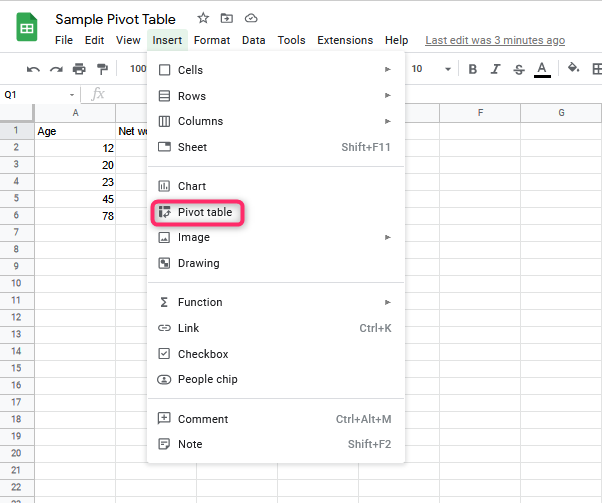
5. From the drop-down menu, select the Pivot table button. If you had selected the cells to be converted, a pivot table would automatically appear on the screen.
6. In case you did not highlight the cells to be converted to the pivot table, follow these steps:
-
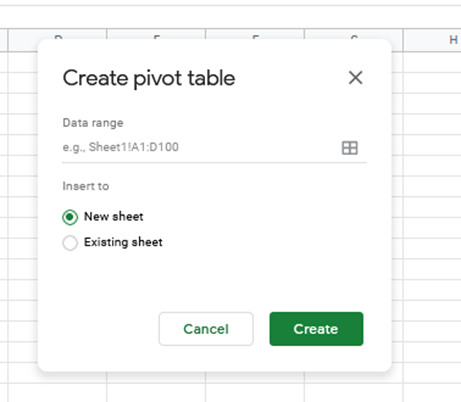
A small dialogue box will pop up after clicking the pivot table on the insert tab.
-
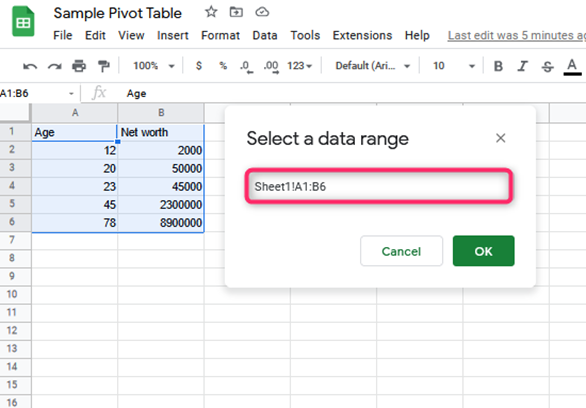
Click on the Data range section and select the dataset you want to convert to a pivot table.
-
In the Insert to Section, toggle on the new sheet button.

- Finally, click the create button.
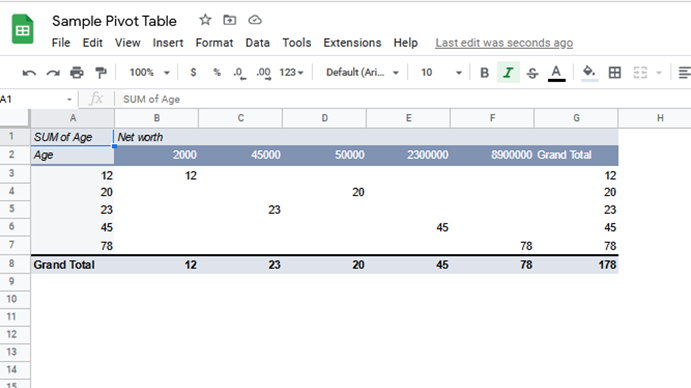
7. By doing so, a Pivot table editor opens on the right side of the screen. Use this pane to set the rows, columns, values, and filters. To do so follows these steps;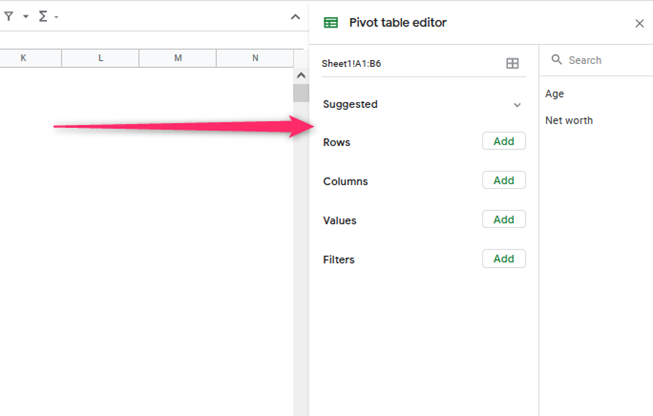
-
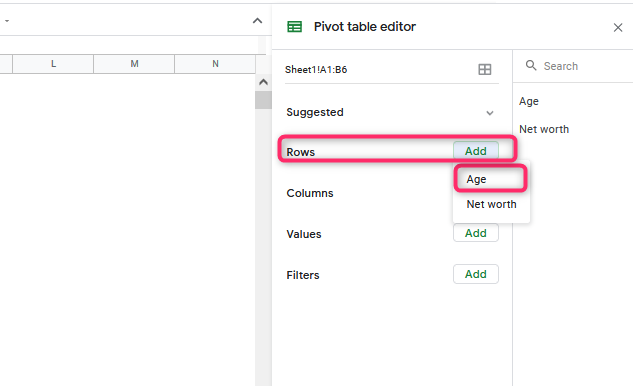
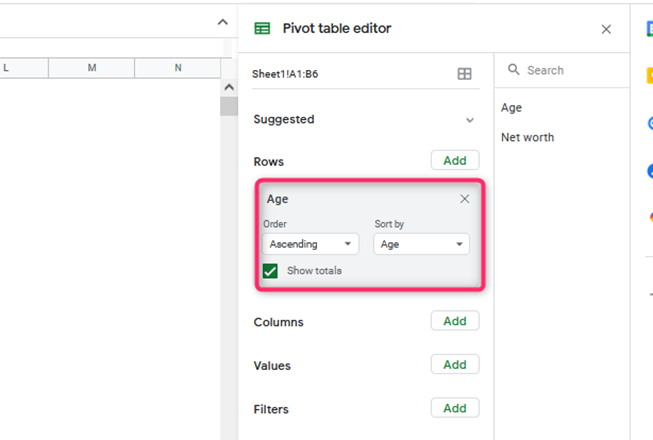
To begin with, let’s set the Rows. On the right-pane, locate Row’s Add button. Click on it. In our case, let’s select the Age as our row.
-
The Age is added to our row. You can set its values to appear in descending or ascending order. Finally, check the Show totals checkbox.
-
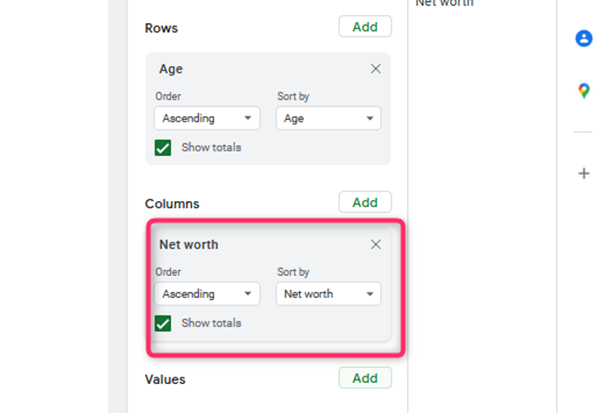
Next, let’s set up the column. So click the Add button next to the columns section. Then, select the other remaining header of your dataset. For instance, in our case, we will select the net worth.
Similarly, either set its value in a descending or ascending order.
-
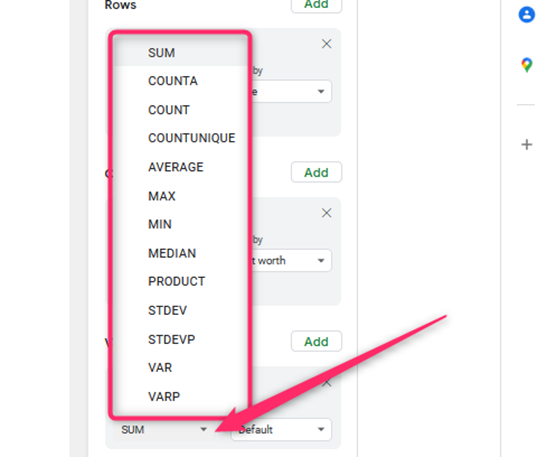
Next, set the values of your pivot table. Click on the Add button next to the Values section. You can summarize your table using in-built mathematical functions found in Google Sheets. For instance, let’s select the Age.

-
Click the Drop-down menu in the Summarize by, and select the formulae to summarize your values.
-
Finally, let’s filter the table. Tap the “Add button” next to the Filter section. Here, you can filter either by a condition or by values.

That’s all. Now you have a pivot table representing your dataset.