

In an organization, they may need to make a hierarchy of their staff. Thankfully, Google Slides allows users to create hierarchy charts. A chart is a tool in Google Slides used to visualize the data. Let us now discuss some of the methods of creating a hierarchy chart in Google Slides.
Using the Diagram feature
Table of Contents
Here are the steps to follow:
1. Open your Google Account. Then, from the Google Apps, Locate the Google Slides and open it.
2. Next, open a new Google slide, or an existing Google Slides that you need to add the chart.

3. Click the Slide button on the top tab. Hover the mouse on the Apply layout, and click on the blank option.

4. Click on the Untitled presentation, edit it and add the name of your hierarchy chart.

5. Next, click on the Insert tab, and click the Diagram button. A Diagram panel appears on the right side of the screen.

6. Select the Diagram that fits your chart best by clicking on it.

7. In the hierarchy section, choose the number of levels your hierarchy chart has and the color of the shapes.

8. Edit the diagram and add your chart’s details. To Edit, double-click on the level you want to edit.

Using tables to make a hierarchy chart
When using a table to make a hierarchy chart, you need to follow these steps:
1. Open your Google Account. Then, from the Google Apps, Locate the Google Slides and open it.
2. Next, open a new Google slide, or an existing Google Slides that you need to add the chart.
3. Click the Slide button on the top tab. Hover the mouse on the Apply layout, and click on the blank option.

4. On the top tab, go to the Insert tab and hover your mouse on the table button.
5. Select a table with only one cell from the drop-down menu.

6. Position the cell and add the hierarchy details.

7. Continue and add the details of the next level of the hierarchy using the table.
8. Next, join the table cells with lines. Go to the insert tab and click on the line button. Alternatively, Go to the toolbar and click the line icon.

9. Choose the line color.
Also, you can create
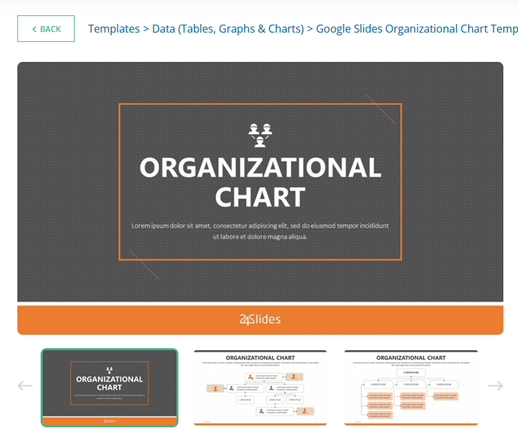
Google Slide hierarchy Chart Templates
Follow these steps to create hierarchy charts in Google Slides:
1. Open your favorite web browser, and search for free organizational templates. For instance, visit this link for free templates https://24slides.com/templates/view/data-tables-graphs-charts/google-slides-organizational-chart-template
2. Some sites allow users to use the template in Google Slides, while others have a separate section for editing the template.
3. If you can use the template in the Google Slides, Copy the template from its source, and paste it onto your Google Slide.
4. Then edit it to fit your desires.