3-based Axis chart is an example of a chart used to express data in chart form. However, this kind of chart is rarely used; thus, its steps are not widely known. There are many instances where the users must apply the knowledge of 3 axis chart to compare data. Therefore it is important to learn and understand the procedure of drawing 3 axis chart. This article will discuss the methods and workarounds to be followed when creating a 3-based chart in Google Sheets and Excel.
To create 3 axis chart in Excel
Table of Contents
Two methods are used:
Using the 3-D feature
Using the ChartExpo add-in feature
Using the 3-D feature
Steps to follow while using this method:
1. Open the Excel application.
2. Enter the data to be converted into a chart in the empty cells.

3. Click on the Insert tab. From the Insert tab, locate the chart section and click the column icon.

4. A drop-down menu opens, displaying various types of charts. From the menu, select either the 3-D column or 3-D bar icon.

To edit the axis of the chart, use these steps:
1. Right-click on the drawn chart.
2. From the side-view menu, select the Format axis button.

3. Then, select the axis option button from the right pane displayed and customize it.
Using the ChartExpo add-in feature
Steps to follow:
1. On the header menu, click on the Insert tab. From the add-ins section, click on the My add-ins button.

2. A new window is displayed. Locate the search bar, and search the ChartExpo tool. Then, click the Add button to install the feature.
How to use ChartExpo
Steps:
1. After installing, enter your data on the empty cells.

2. Then, click on the Insert tab on the header menu. From the add-ins section, click on the My add-ins button.

3. Select the ChartExpo tool. It will be displayed on your screen. Go ahead and edit.
4. Highlight the data you need to extract the table from.
5. On the chartExpo tool, click the Create a chart from the selection button. The highlighted data will automatically be converted into a chart.

6. Modify the 3-axis chart displayed.
To create 3 axis chart in Google Sheets
Here are the steps to follow:
1. Visit the Google account and log in using your email detail (That is, https://www.google.com/account).
2. From the Google Apps, click on the Sheets icon and select the existing Sheet.

3. Enter the dataset you want to convert into a chart.
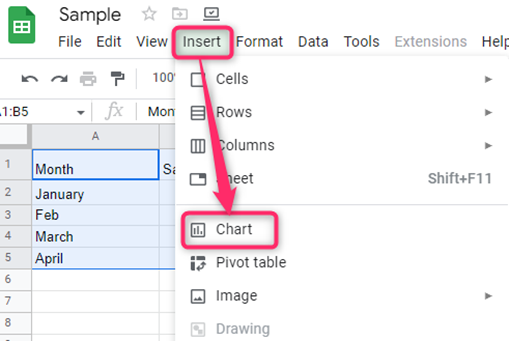
4. Highlight the dataset, click on the Insert tab, and choose the Chart option. The chart of the selected dataset will be drawn on the screen.
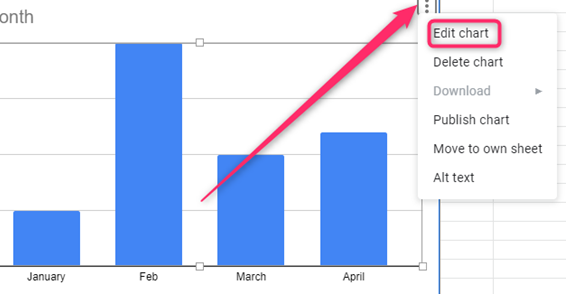
5. Click on the three dots on the top-right side of the chart section.
6. From the menu, click on the Edit Chart button.
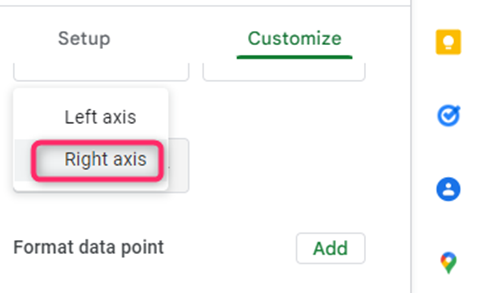
7. From the right pane, click on the Customize tab. Click the series drop-down button and select the units you want to use on your 3rd axis.

8. Then, choose the Right axis option under the Axis section.